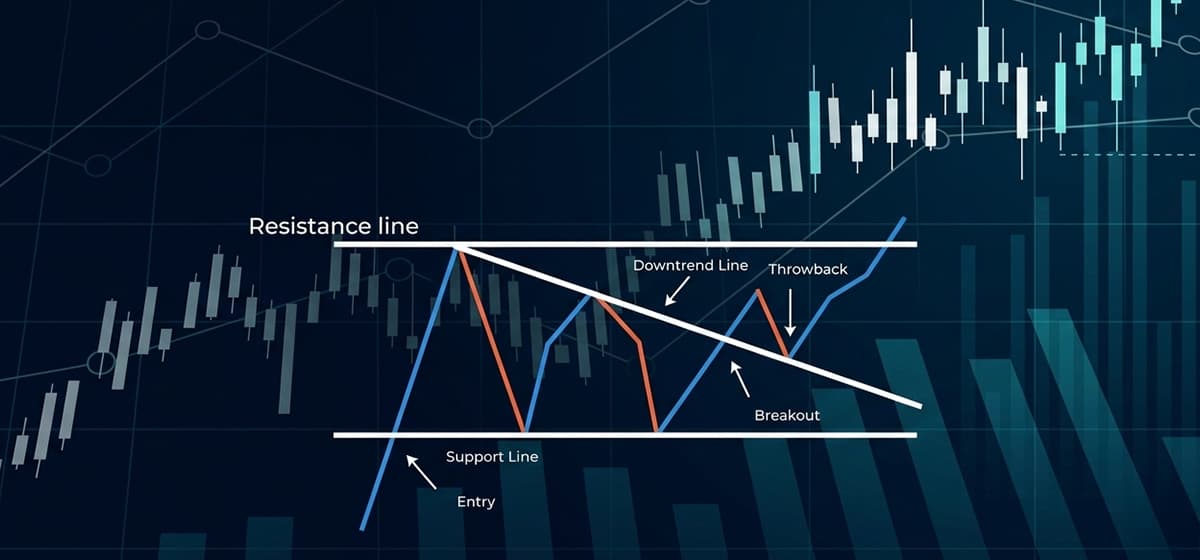
Understanding the Descending Triangle Chart Pattern in Crypto Trading
Key Takeaways:
- The descending triangle pattern is usually considered a bearish continuation pattern.
- It consists of a flat support level and a downward-sloping resistance line.
- The pattern reflects increasing selling pressure as buyers struggle to hold support.
- A breakdown below support often signals potential continuation of a downtrend.
- Volume confirmation plays an important role in validating a breakout.
Technical analysis plays a vital role in the cryptocurrency industry. Chart patterns are used by traders and investors to anticipate price movements. One of the most common chart patterns used for this purpose is the descending triangle chart pattern. This pattern can provide traders with valuable insight during volatile markets, offering clues about future market direction.
In this blog, we will look at what a descending triangle chart pattern is, how to identify it, what it suggests, and how you can use it to enhance your crypto trading strategies.
Let’s begin!
What is a Descending Triangle Pattern?
The descending triangle pattern indicates bearish conditions by forming a downward trend. This pattern consists of a descending trendline at the top and a horizontal support line at the bottom. The descending line represents the growing pressure on sellers, whereas the horizontal line indicates a consistent level of demand.
And the price of digital assets moves within this structure, the lows remain constant while the highs keep getting lower. Eventually, the support level simply gives way, and that results in a breakdown. This breakdown is taken as a strong signal to sell, leading to traders selling off their assets.
How to Identify a Valid Descending Triangle Pattern
Identifying a valid descending triangle pattern requires attention to the structure, market trend, and volume. Traders look for specific characteristics that confirm the formation is reliable rather than random price movement. A valid descending triangle pattern typically follows these criteria:
- The price forms at least two or three lower highs, which can be connected with a downward-sloping resistance line.
- At least two lower horizontal lines appear with some distance separating the lows.
- The support level is tested multiple times without breaking immediately.
- Trading volume gradually decreases as the pattern develops.
- A breakdown of the support occurs when there is increased volume to confirm the pattern.
In cryptocurrency markets, price volatility often creates long wicks on the candlestick chart. For better accuracy, traders usually focus on candlesticks instead of extreme highs or lows. This approach helps avoid misinterpreting temporary spikes as part of the pattern.
Traders must also consider the timeframe. Descending triangles appear across different timeframes, but higher timeframes, such as 4-hour or daily charts, often provide clearer signals than lower ones.
Market Psychology Behind the Pattern
Understanding the psychology behind the descending triangle pattern helps traders interpret its signals more effectively. The pattern reflects a gradual shift in market control from buyers to sellers. Initially, buyers attempt to hold a strong support level. Each time the price drops to this level, buyers step in and push the price upward.
However, these rebounds become weaker over time, resulting in lower highs. This indicates that buying momentum is fading. At the same time, sellers grow more confident. Instead of waiting for higher prices, they begin selling earlier during each rally. This persistent selling pressure pushes the resistance line downward and increases the likelihood of a breakdown.
As the pattern approaches its apex, market tension builds. Buyers struggle to maintain support, while sellers continue to apply pressure. Eventually, sellers overwhelm buyers, causing the support line to break. When this happens, many buyers exit their positions simultaneously, accelerating the downward movement.
This shift in sentiment is what gives the descending triangle its bearish reputation.
Usual Signals and Bias (No Guarantees)
The descending triangle pattern generally carries a bearish signal. Traders often interpret the pattern as a signal that the market may continue moving downward after breaking below the support level. The expected outcome of the pattern is a downward breakout accompanied by increased trading volume.
This surge in volume indicates that sellers have taken control and that the breakdown is likely to continue. However, it is important to understand that no pattern guarantees a specific outcome. Cryptocurrency markets are highly volatile and can produce false signals. Sometimes, the price briefly breaks below support and then quickly reverses upward.
These situations are known as false breakouts or fakeouts. Because of these risks, traders should always combine the descending triangle pattern with additional technical indicators, such as volume analysis, trend confirmation tools, and broader market context.
Where Does the Pattern Appear?
The descending triangle pattern typically appears in markets experiencing sustained selling pressure. It often forms in specific market conditions that indicate weakening bullish strength. Common places where the pattern appears include:
- After a prolonged downtrend, sellers maintain control.
- Near major resistance zones where price struggles to move higher.
- During consolidation phases within bearish markets.
- Around psychological price levels, traders frequently place orders.
The pattern may also appear on lower timeframes, such as 5-minute or 15-minute charts. However, these formations often produce more false signals due to market volatility. Higher timeframes, such as 4 hours or daily, can generally offer more reliable setups.
Market conditions also influence reliability. During strong bullish rallies or major positive news events, descending triangles may fail to produce expected breakdowns. In such cases, traders should exercise caution and wait for confirmation before entering positions.
How to Trade Descending Triangle Pattern?
Trading the descending triangle pattern requires careful planning and disciplined execution. Traders must determine entry points, stop-loss levels, and profit targets before placing a trade.
Entry Strategies
There are two commonly used entry methods when trading this pattern:
- Entry on the Break: This method involves entering a short position once the price closes below the support level. It is a direct approach but carries a higher risk because the breakout may not sustain.
For example:
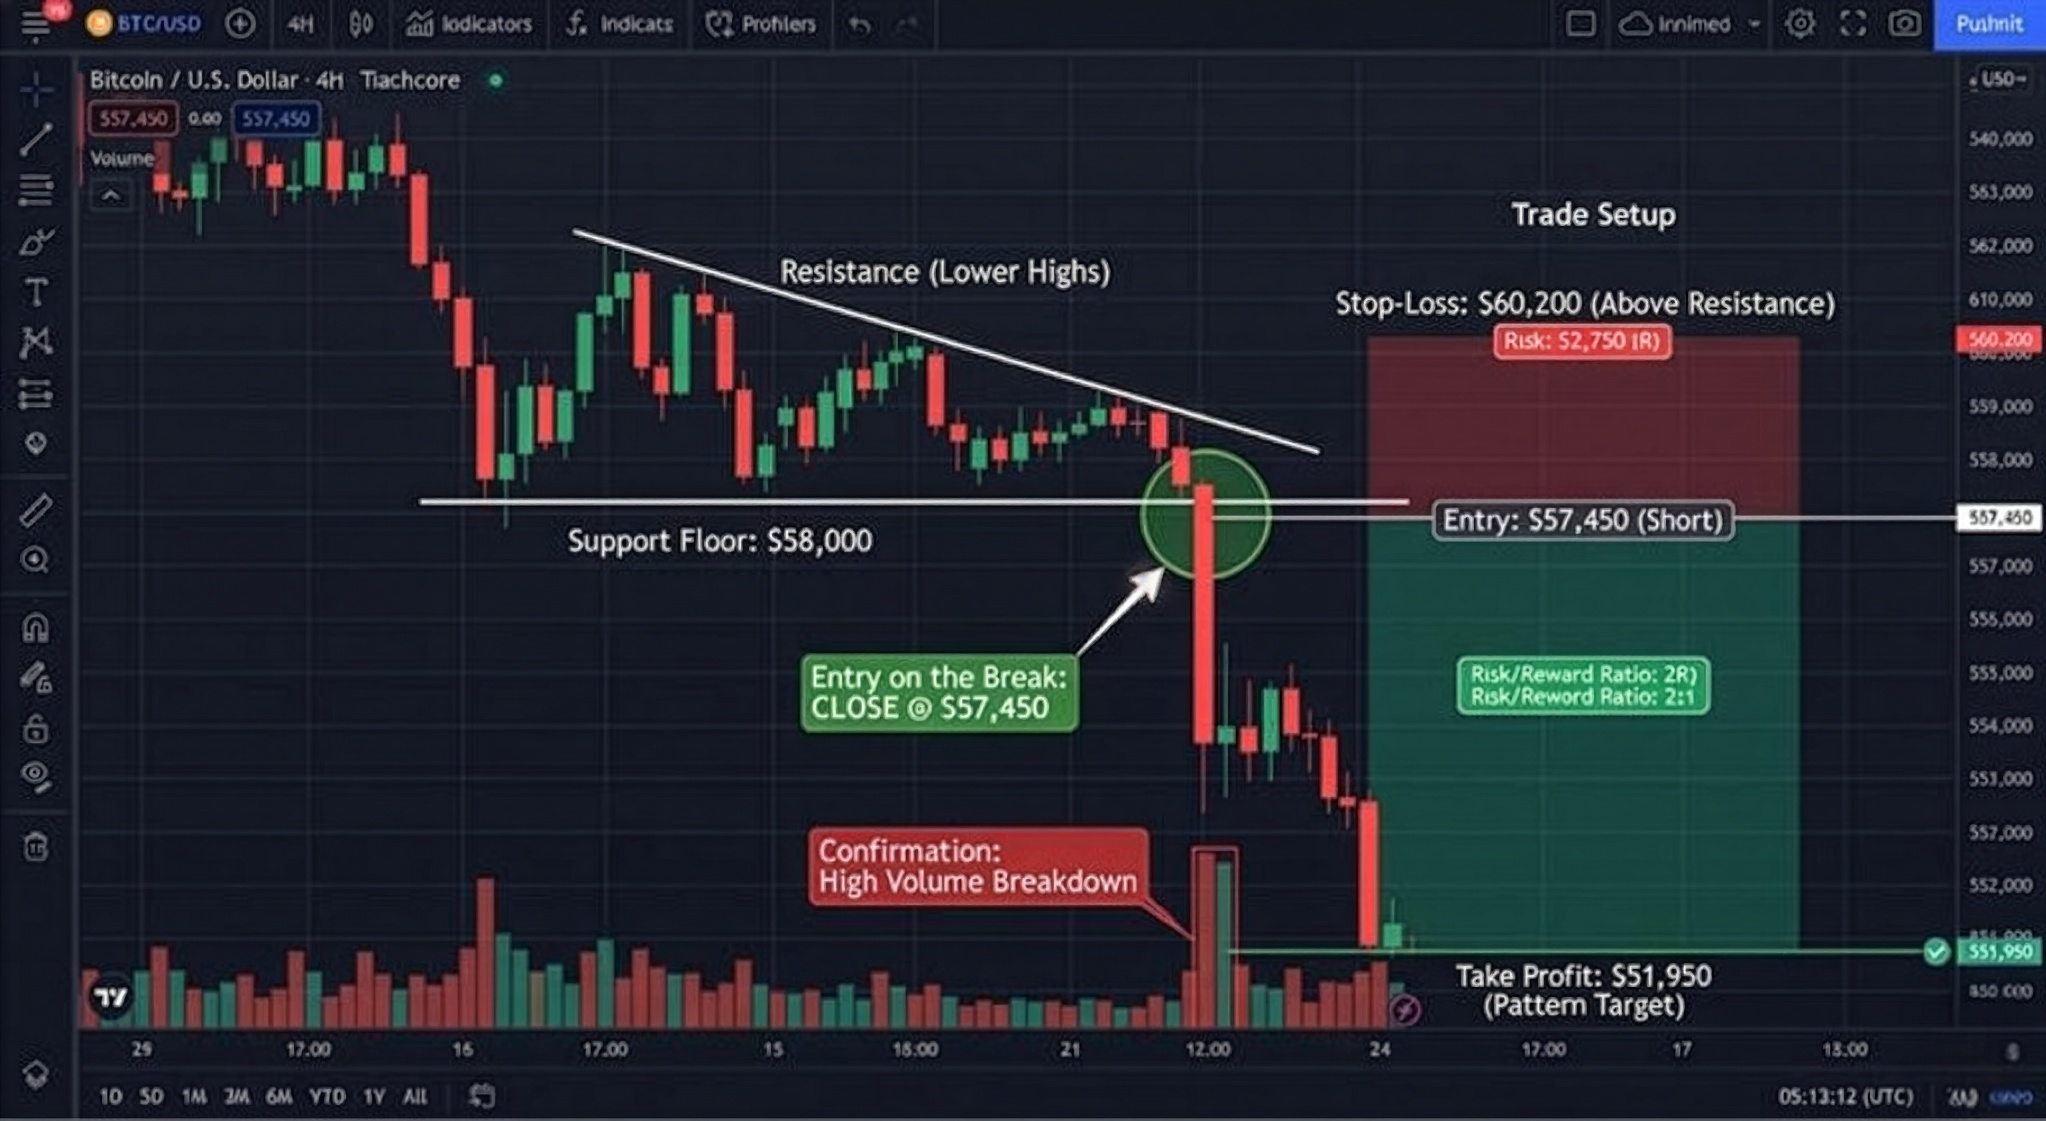
This example demonstrates an Entry on the Break strategy for a descending triangle on a Bitcoin chart, where a short position is opened the moment the price closes below the $58,000 support floor. By entering at $57,450, the trader captures the immediate downward momentum confirmed by a surge in selling volume. To manage risk, a stop-loss is placed at $60,200, which is just above the descending resistance line. It is placed there to protect against a potential "bull trap" or fakeout. The take-profit target is set at $51,950.
- Entry on the Retest: A more conservative approach is waiting for the price to break below support and then retest the level as resistance. This method often provides a better risk-to-reward ratio and reduces the chances of entering during a false breakout.
For example:
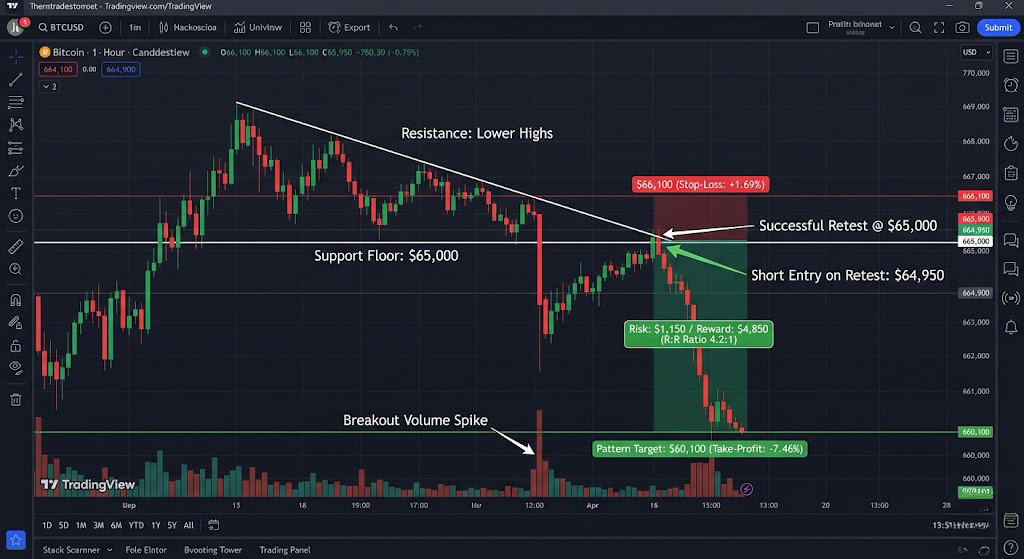
In this Entry on the Retest strategy for Bitcoin, the trader waits for the price to break below the $65,000 support floor and then pull back to test that same level from below. By entering a short position at $64,950 once the old "floor" is confirmed as a new "ceiling" (resistance), the trader gains a much higher degree of confidence that the breakdown is legitimate. This conservative approach allows for a tighter stop-loss at $66,100, resulting in an exceptional risk-to-reward ratio as the price heads toward the $60,100 target.
Setting the Stop-loss Order
Stop-loss order placement is essential for risk management. Traders usually place stop-loss orders slightly above the previous support level or above the most recent lower high. This allows the trade to move while protecting against unexpected reversals. Another method involves placing the stop-loss order two candles above the breakdown level, giving the market enough space to fluctuate without prematurely closing the trade.
Price Targets
Profit targets help traders lock in gains systematically. Usually, traders measure the height of the triangle and protect that distance downward from the breakout point. Traders may also set multiple targets at previous support levels to secure profits gradually. Maintaining a favorable risk-to-reward ratio, such as 1:3, improves long-term trading performance.
Additional Trading Tips
- Wait for a confirmed breakout before entering trades.
- Avoid entering positions based on anticipation alone.
- Monitor trading volume closely for confirmation signals.
- Use proper position sizing to manage risk effectively.
What If The Pattern Fails?
Much like all technical patterns, descending triangles can fail. A failed pattern occurs when the price breaks below support but quickly reverses and moves back above the level. This invalidates the bearish signals. Another sign of failure occurs when the price breaks upward instead of downward. In such cases, buyers regain control, and the expected bearish continuation does not occur.
When the pattern fails, traders should:
- Exit the position immediately to prevent further losses.
- Avoid adding to losing trades in an attempt to recover losses.
- Reassess the overall trend and market structure.
- Wait for a new setup before entering another trade.
Common Mistakes to Avoid
Many traders struggle with the descending triangle pattern due to avoidable mistakes. Being aware of these errors can improve consistency and reduce unnecessary losses. Some common mistakes that you should avoid include:
- Entering trades before the breakout is confirmed.
- Ignoring volume signals that validate price movement.
- Misidentifying random price swings as a triangle pattern.
- Placing stop-loss orders too close to entry points.
- Trading without considering the broader market trend.
- Relying solely on the pattern without using supporting indicators.
Final Takeaways
The descending triangle is one of the most widely recognized chart patterns in cryptocurrency trading. It offers insights into the market sentiment and potential price movement with its distinctive structure. While traditionally taken as a bearish pattern, traders can carefully combine the pattern with broader technical analysis to enhance their understanding of the market conditions and make informed decisions.
Your $30,000 bonus + 10% discount are waiting on Bybit! Sign up and claim these rewards before they're gone. Time's ticking!
FAQs
What is a descending triangle?
A descending triangle is a chart pattern formed by a flat support line and a descending resistance line. It often signals a potential continuation of a downward trend.
Is a descending triangle always bearish?
It is typically considered a bearish pattern because it often breaks downwards. However, an upward breakout can still occur in strong bullish markets.
What does a downward breakout mean?
It suggests sellers have overtaken buyers, potentially leading to further price decline. Traders often view it as a continuation of a bearish trend.
How reliable is the descending triangle pattern?
It is statistically reliable but not guaranteed. The cryptocurrency industry’s volatility means traders should use confirmation signals, stay updated with the latest news, and manage risk accordingly.
Disclaimer: All content on The Moon Show is for informational and educational purposes only. The opinions expressed do not constitute financial advice or recommendations to buy, sell, or trade cryptocurrencies. Trading involves significant risk and may result in substantial losses. Always seek independent financial advice before making investment decisions. The Moon Show is not responsible for any financial losses or decisions made based on the information provided.
Please view the full disclaimer at: https://themoonshow.com/disclaimer

Leverage Trading in Crypto: How It Works, Risks, and Examples
Leverage trading lets crypto traders control larger positions using borrowed funds or derivativ...
Margin Trading for Beginners: Leverage, Risks, and Examples
Margin trading for beginners starts with understanding how borrowed funds change risk. A small ...

Find Lost Crypto Wallets – A Step-by-Step Recovery Guide
Losing a crypto wallet does not always mean losing access to assets. Recovery may be possible i...