 Price Prediction: Bulls Eye $20 Resistance Amid Ongoing Consolidation")
Chainlink (LINK) Price Prediction: Bulls Eye $20 Resistance Amid Ongoing Consolidation
LINK is currently trading near the $17.5 mark and continues to move sideways on lower timeframes. As mentioned in our previous analysis, the price remains below the resistance level around $20.0 and is struggling to break above it. The broader trend for LINK is still bearish, and reclaiming higher levels is important for bulls to build short-term momentum. There are some early signals suggesting a possible upside move, but flipping the current trend will not be easy. Let’s take a closer look at the latest LINK charts to understand where the price might be headed in the coming days.
Our LINK Price Prediction Summary
- LINK is holding steady near $17.5 as it trades sideways, with momentum building but no clear breakout yet.
- The bullish divergence on the daily chart signals early recovery signs, but the broader trend remains bearish.
- A confirmed breakout from the current symmetrical triangle will define whether LINK moves into recovery or resumes its decline.
Register on WEEX and verify your identity to earn up to 100 USDT. Deposit funds and participate in trading to access further rewards.
Analyzing the Chainlink Charts
Bullish Divergence Signals Short-Term Recovery
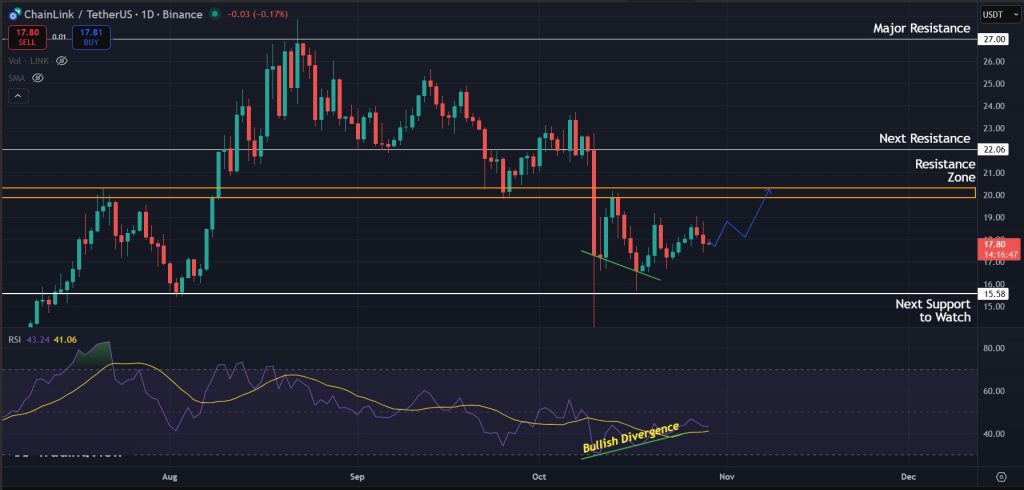
On the 1-day timeframe, LINK is starting to gain momentum after forming a bullish divergence on the RSI. This setup shows that buying pressure is slowly returning, and the price is now aiming to retest the $20.0 level. This area remains a key resistance zone that bulls must reclaim to shift short-term sentiment. A clean break above it would signal strength and could mark the start of a potential recovery. If the price fails to push through and faces rejection again, LINK will likely continue its sideways movement for a while, possibly followed by another minor correction.
Consolidation Phase Tightens Between Key Levels
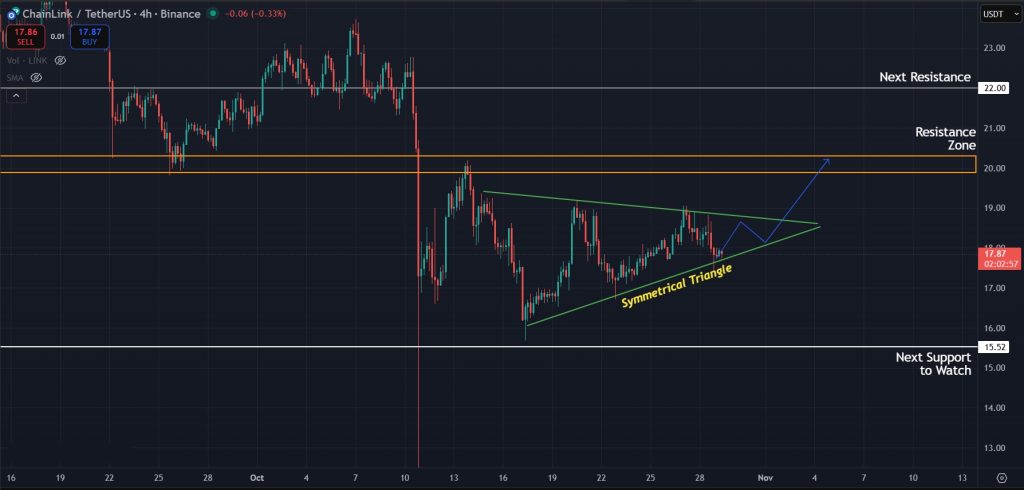
Switching to the 4-hour timeframe, the chart shows LINK moving in an uptrend after rebounding from the $15.5 support level. The price is forming a series of higher lows, suggesting gradual recovery. At the moment, it appears that LINK is on track to retest the $20.0 zone once again. However, the price is also being squeezed within a symmetrical triangle pattern, indicating a period of consolidation. This pattern is generally considered neutral and can break in either direction. Given the bullish divergence visible on the 1-day chart, the chances of an upside breakout look reasonable, though the broader trend remains bearish. For now, this structure should be approached with caution until a clear breakout confirms the next direction.
Key Support Level to Watch if Momentum Fades
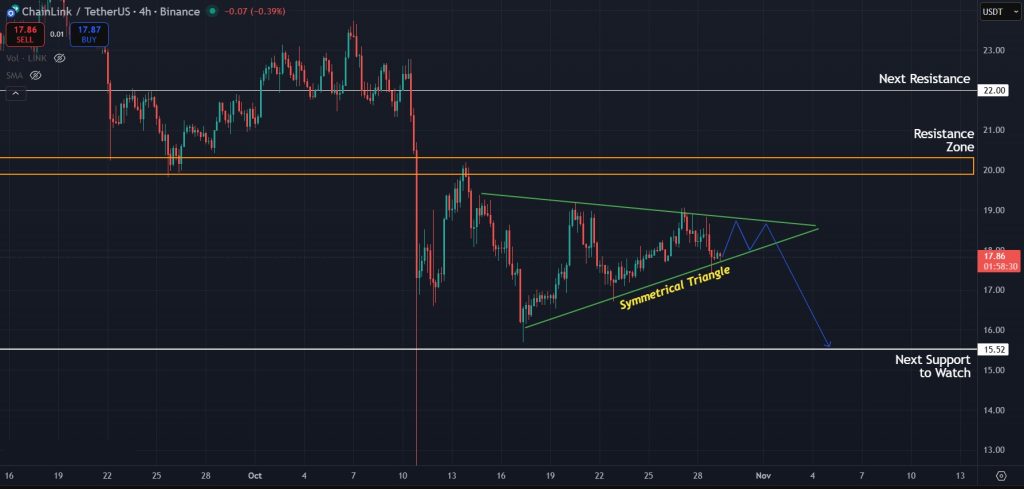
On the other hand, if this structure breaks to the downside amid rising market fear, the broader downtrend will likely continue. The first key level to watch in that case is the support at $15.5. How the price reacts here will be important, as a failure to hold this level could increase the chances of a deeper correction. For now, the broader market bias remains bearish overall, while our LINK price prediction for the short term stays neutral as the price consolidates within the symmetrical triangle.
Final Takeaway: What is Next for LINK?
To sum up, LINK is currently consolidating between key levels as traders wait for confirmation of its next move. The $20.0 resistance remains the main barrier that needs to be broken for any sustainable upside, while the $15.5 support continues to act as a strong base. The bullish divergence on the RSI hint at short-term recovery potential, but the broader trend still leans bearish. For now, the market is in a wait-and-see phase, and a decisive breakout from the symmetrical triangle will determine whether LINK enters a new recovery phase or extends its correction further.
Join WEEX today and walk away with a deposit bonus, a coupon worth up to 100 USDT, and trading rewards that grow as you trade more.
Disclaimer: All content on The Moon Show is for informational and educational purposes only. The opinions expressed do not constitute financial advice or recommendations to buy, sell, or trade cryptocurrencies. Trading involves significant risk and may result in substantial losses. Always seek independent financial advice before making investment decisions. The Moon Show is not responsible for any financial losses or decisions made based on the information provided.
Please view the full disclaimer at: https://themoonshow.com/disclaimer

Bitcoin Drops Toward $62K As Chip Selloff And Strategy Warning Pressure BTC
Bitcoin came under pressure again on June 24 as the wider selloff in chip and AI-linked stocks ...

XRP Slides Toward $1.10 As Buyers Face Another Support Test
XRP is back near a level buyers have defended several times this month. The token traded close ...

Bitcoin Holds Near $65K as Bear-Flag Warning Keeps $60K In Focus
Bitcoin held near $65K as traders weighed a bearish chart warning, cautious derivatives positio...