 Price Prediction: New All-Time High Puts Key Targets Back in Play")
Bitcoin (BTC) Price Prediction: New All-Time High Puts Key Targets Back in Play
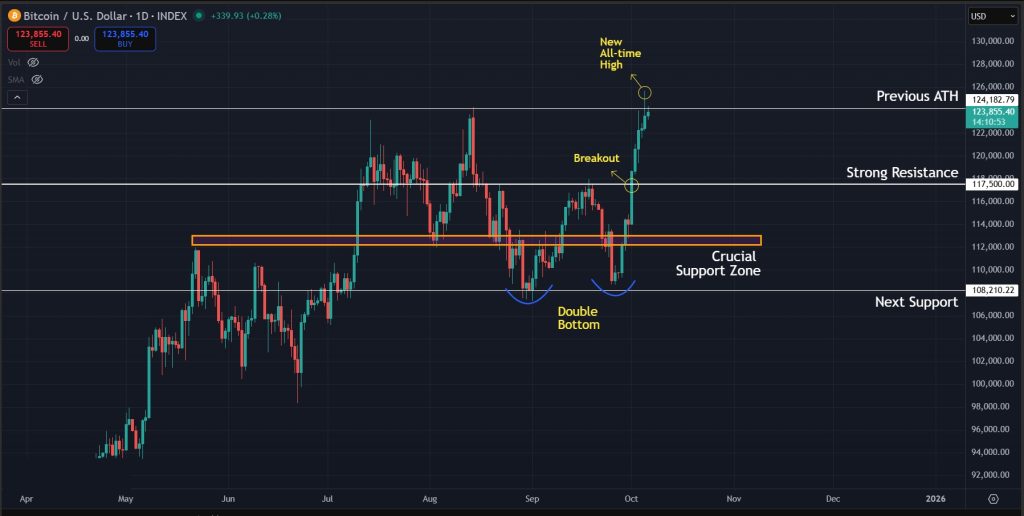
Bitcoin is currently trading just below the $124,000 mark and is showing strong momentum on the lower timeframes. As discussed in our previous analysis, the price successfully broke above the resistance at $117,500, and the double-bottom pattern we highlighted also played out, pushing Bitcoin to new all-time highs. At the moment, the market is largely green and the bulls appear to be in control. Now, let’s take a look at the latest BTC charts to determine whether this momentum is likely to continue or if a short-term pullback is on the horizon.
Our Bitcoin Price Prediction Summary
- Bitcoin broke key resistance and printed new all-time highs, keeping the broader trend bullish.
- The $127K level is still the immediate upside target, with $130K and $140K in sight if momentum holds.
- Overbought signals and bearish divergence on lower timeframes hint at a possible short pullback or consolidation.
Join WEEX and verify your account to claim a 10–100 USDT coupon. Fund your account to access deposit bonuses and ongoing trading rewards.
Analyzing the Bitcoin Charts
Double-Bottom Breakout
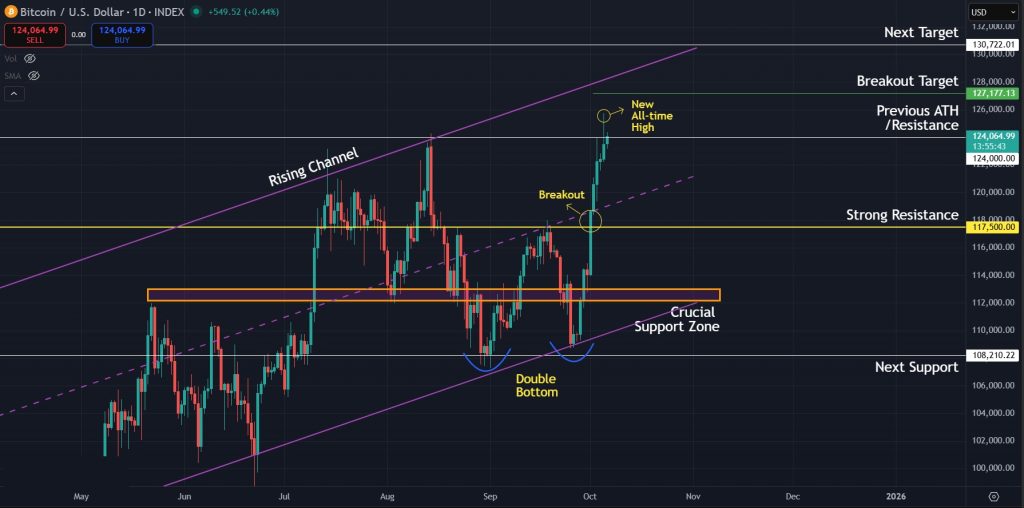
Looking at the latest 1-day chart for Bitcoin, the first clear development is the breakout above the strong resistance at $117,500. That move also acted as the trigger for the double-bottom pattern to play out and push the price higher. The technical target for this pattern was around the $127,000 area, and while Bitcoin did not reach that exact level, it broke out and set new all-time highs slightly above $125,500.
Channel Structure and Target Levels
With the price gaining momentum and new all-time highs forming, the immediate level to watch for Bitcoin on the 1-day timeframe is the $127,000 area, as it is the breakout target that has yet to be met. The price is also still moving within a rising parallel channel, which suggests that Bitcoin will likely continue respecting this trend and form a clearer higher high before any potential pullback. If the price reaches $127,000 and holds, the next key zone bulls will be eyeing is the region above $130,000, which acts as the next psychological barrier. Beyond that, the $140,000 level stands out as the broader target many traders expect for this bull market.
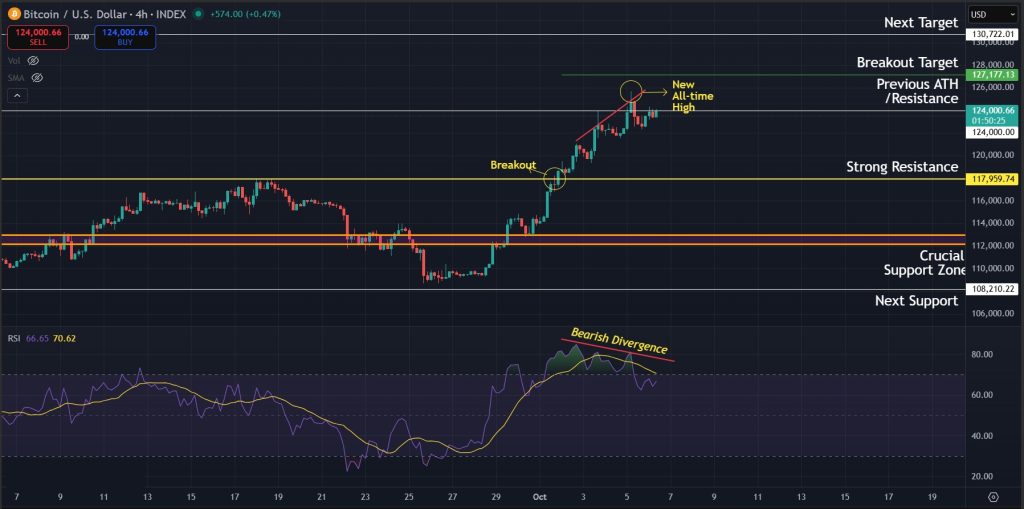
Short-Term RSI and Divergence Signals
On the 4-hour timeframe, the immediate target remains around the $127,000 mark. However, the RSI has entered overbought territory, and a bearish divergence is forming on the 4-hour RSI. This signals the possibility of a short-term pullback or a period of consolidation before Bitcoin makes its next move, so traders should be cautious. Overall, our current Bitcoin price prediction still leans bullish, as the bulls are showing signs of strength for now. Though, the $124,000 resistance could prove challenging, and failure to break above it could shift the momentum.
Final Takeaway: What is Next for Bitcoin?
Bitcoin has shown strong momentum after breaking key resistance levels and setting new all-time highs, and the broader trend still favors the bulls. On the higher timeframes, the price is respecting the rising parallel channel and has not yet reached the $127,000 breakout target, which remains the next key level to watch. If that target is met and held, $130,000 and eventually $140,000 are the next areas likely to come into focus. Lower timeframes are starting to show early signs of exhaustion, with the RSI overbought and a bearish divergence forming. This suggests that a minor pullback or consolidation phase could occur before any further push to the upside. The $124,000 resistance is also a critical level in the short term and could affect momentum if it holds. For now, the overall outlook stays bullish, but traders should stay alert to short-term corrections as Bitcoin works its way toward its next major targets.
Register on WEEX and verify your identity to earn up to 100 USDT. Deposit funds and participate in trading to access further rewards.
Disclaimer: All content on The Moon Show is for informational and educational purposes only. The opinions expressed do not constitute financial advice or recommendations to buy, sell, or trade cryptocurrencies. Trading involves significant risk and may result in substantial losses. Always seek independent financial advice before making investment decisions. The Moon Show is not responsible for any financial losses or decisions made based on the information provided.
Please view the full disclaimer at: https://themoonshow.com/disclaimer

Bitcoin Drops Toward $62K As Chip Selloff And Strategy Warning Pressure BTC
Bitcoin came under pressure again on June 24 as the wider selloff in chip and AI-linked stocks ...

XRP Slides Toward $1.10 As Buyers Face Another Support Test
XRP is back near a level buyers have defended several times this month. The token traded close ...

Bitcoin Holds Near $65K as Bear-Flag Warning Keeps $60K In Focus
Bitcoin held near $65K as traders weighed a bearish chart warning, cautious derivatives positio...