 in Crypto?")
What is the Relative Strength Index (RSI) in Crypto?
Technical indicators play a central role in cryptocurrency trading by helping traders analyze price trends, momentum, and market conditions. One such indicator that helps traders identify overbought and oversold market conditions is the Relative Strength Index (RSI). It predicts the price behavior, helps traders validate market movements and trend reversals, and provides buy and sell signals.
Let’s explore the RSI indicator, its applications, and limitations to help you better understand it.
Understanding the Relative Strength Index (RSI) Indicator
The Relative Strength Index (RSI) is a momentum oscillator that was developed by J. Welles Wilder Jr. in 1978. The indicator is used in technical analysis of cryptocurrencies to measure the strength and momentum of the price movement over a period of 14 days. It helps identify overbought and oversold market conditions and detect trend reversals early, enabling traders to find the correct entry and exit points.
As an oscillator, it oscillates between 0 and 100. The two most valuable levels of the RSI indicator are the 70-level and the 30-level. When the RSI is above the 70-level, it is considered overbought, meaning the buyers are holding and they have pushed the price too high. It could signal a potential pullback, so selling a cryptocurrency here immediately without confirmation, such as a bearish candle or dropping volume, might not be valuable.
On the other hand, when the RSI is below the 30-level, it indicates that sellers are holding and might have dumped the coin heavily, causing the price to fall. Instead of buying immediately, wait for confirmation, such as a bullish reversal candle or rising volume.
Your $30,000 bonus + 10% discount are waiting on Bybit! Sign up and claim these rewards before they're gone. Time's ticking!
How to Read RSI?
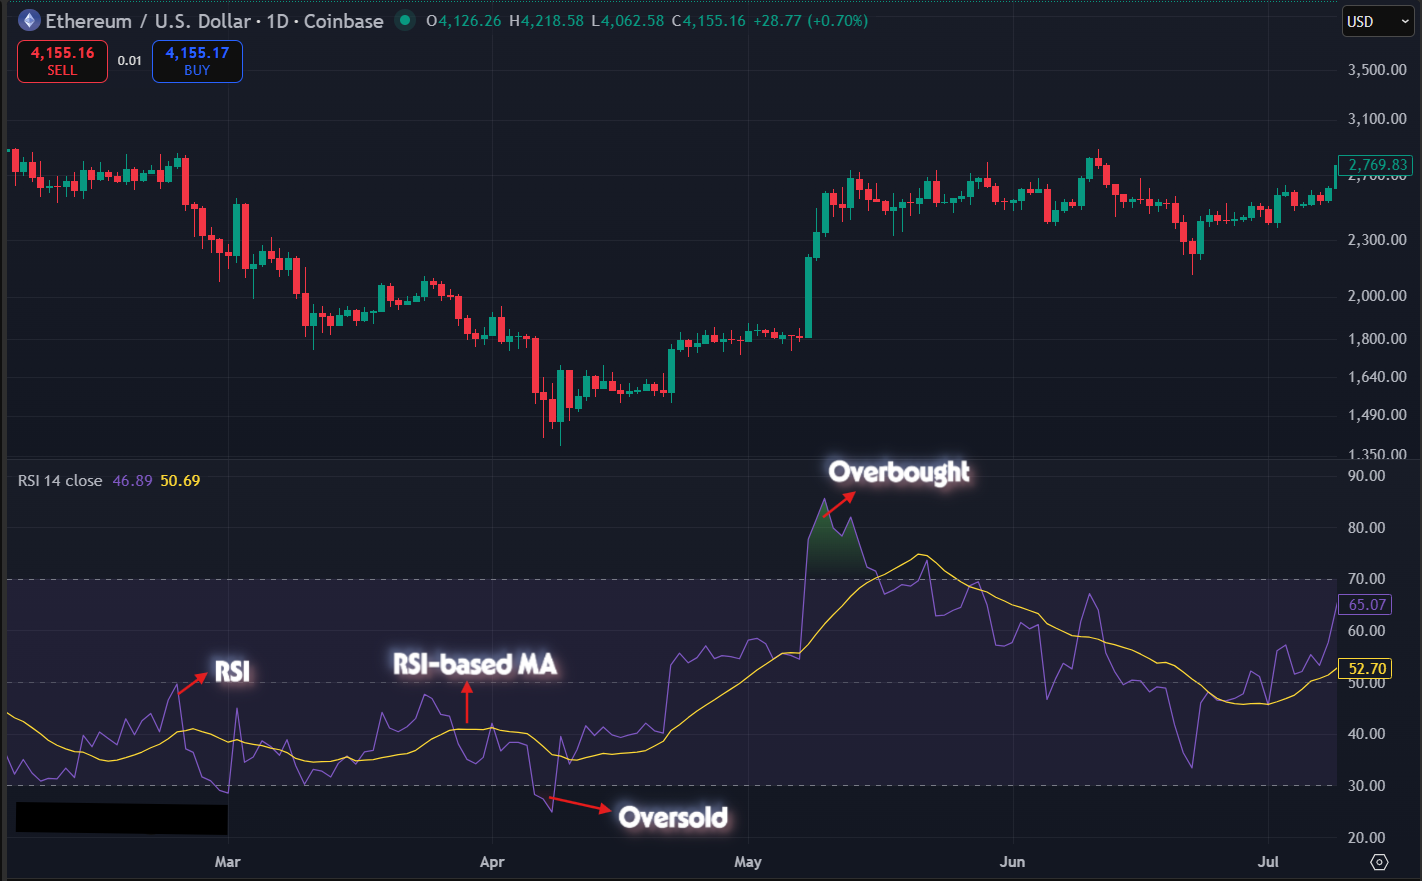
The Relative Strength Index (RSI) is a momentum indicator that is plotted on the graph under the price. The two lines on the chart are the RSI line and the RSI-based MA (Moving Averages) line. The basic functionality of the RSI line is to indicate when the market is overbought or oversold. The RSI-based MA line is a moving average applied to the RSI, smoothing out the RSI readings by averaging them over a selected period.
Traders see a cryptocurrency as oversold (below the 30-level) when it has persistent sell pressure and the RSI indicates it is set to move upward. Conversely, a digital currency is overbought (above the 70-level) when it is heavily bought, and the RSI shows it is set to rally downward.
The RSI indicator is more useful over extended time frames, such as the daily time frame. In these time frames, the RSI helps traders analyze how well it indicates changes in the price movement of a particular digital asset.
The following chart shows how the RSI indicator appears when applied to a chart. The chart below on TradingView is showing price action and RSI for the ETH/USDT pair on the daily timeframe.
However, it is crucial to understand that cryptocurrency traders do not always prefer the 30 and 70 levels or the 14-day RSI line. Depending on the market conditions and the selected time frames, levels such as 20 and 80 might be more useful. Therefore, it could be beneficial to use different RSI levels depending on such factors.
How Does the RSI Work?
The Relative Strength Index (RSI) works as an oscillator and measures the movement of price by comparing it with a cryptocurrency’s average gains and losses over a given time. It helps traders gauge market sentiments and identify potential turning points in price trends.
As mentioned above, an RSI above the 70-level indicates the digital asset is overbought or overvalued, signaling a potential downward correction. When it starts to decline below this level, it signals a selling opportunity, suggesting the uptrend may be ending and a downtrend could begin soon. On the other hand, an RSI below the 30-level shows the asset may be oversold or undervalued, suggesting a potential upward movement. When it starts to rise above this level, it is commonly seen as a buy signal, meaning the downtrend may be ending and an uptrend could begin.
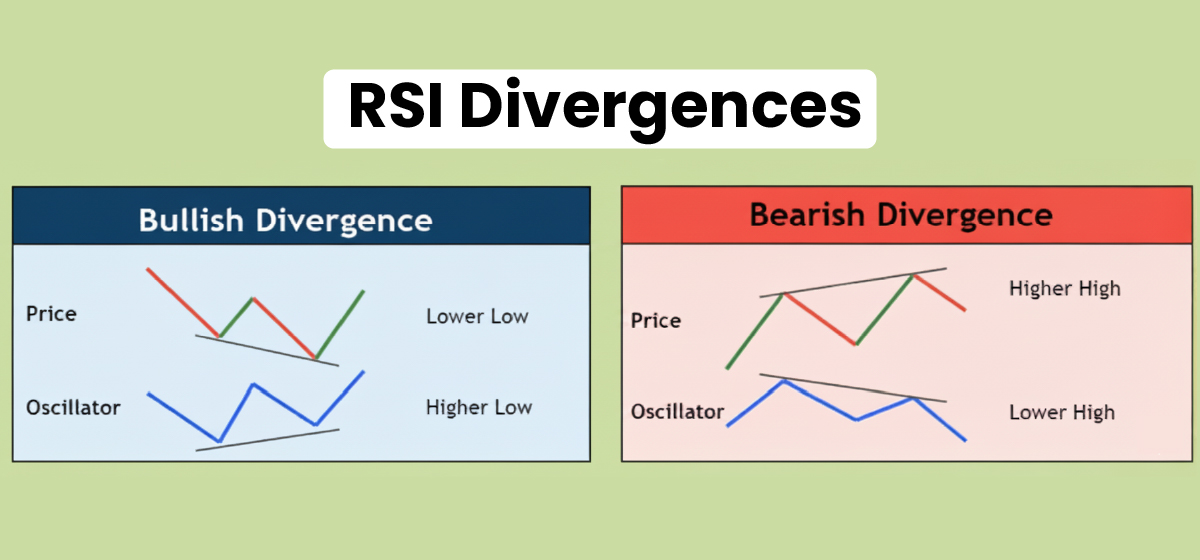
Another significant identification of the RSI indicator is divergence, which occurs when the price and the RSI line move in opposite directions. A bullish divergence occurs when the price forms a lower low, but the RSI line forms a higher low, indicating a potential upside reversal as buyers step in. A bearish divergence occurs when the price forms a higher high, but the RSI line forms a lower high, signaling a possible downturn and indicating that market momentum is fading.
How to Calculate the RSI Value?
Calculating the RSI value is a complex phenomenon, although you can get a basic understanding with the following formula. The Relative Strength Index (RSI) is calculated by taking the average size of price gains on up days and declines on down days over time, with 14 being the default value. It oscillates between 0 and 100, and its midpoint is 50.
RSI = 100 – (100 ÷ (1 + RS))
Here, RS (Relative Strength) represents the average gains over a specified period/average loss over the same period. It indicates a bullish momentum when the value is above 50, and a bearish momentum when it is under 50.
How to Apply the RSI Indicator?
The correct settings of the RSI indicator depend on market analysis and the trading strategy. By default, RSI is calculated based on the average of recent upward moves in the price versus the average downward price changes over 14 days. However, you can adjust the settings of the indicator to better align with your trading strategy.
- Shorter Periods: Suppose you change the RSI value to 7. It increases the sensitivity of RSI to market movements, making it useful for short-term trading or volatile markets.
- Longer Periods: Suppose you change the RSI value to 21. It smooths out RSI signals, helping you better analyze long-term trends and avoid false signals.
Remember, the optimal RSI settings depend on your trading strategy, selected digital asset, and changing market dynamics. Understanding how these settings can impact RSI performance can help you use the indicator more effectively.
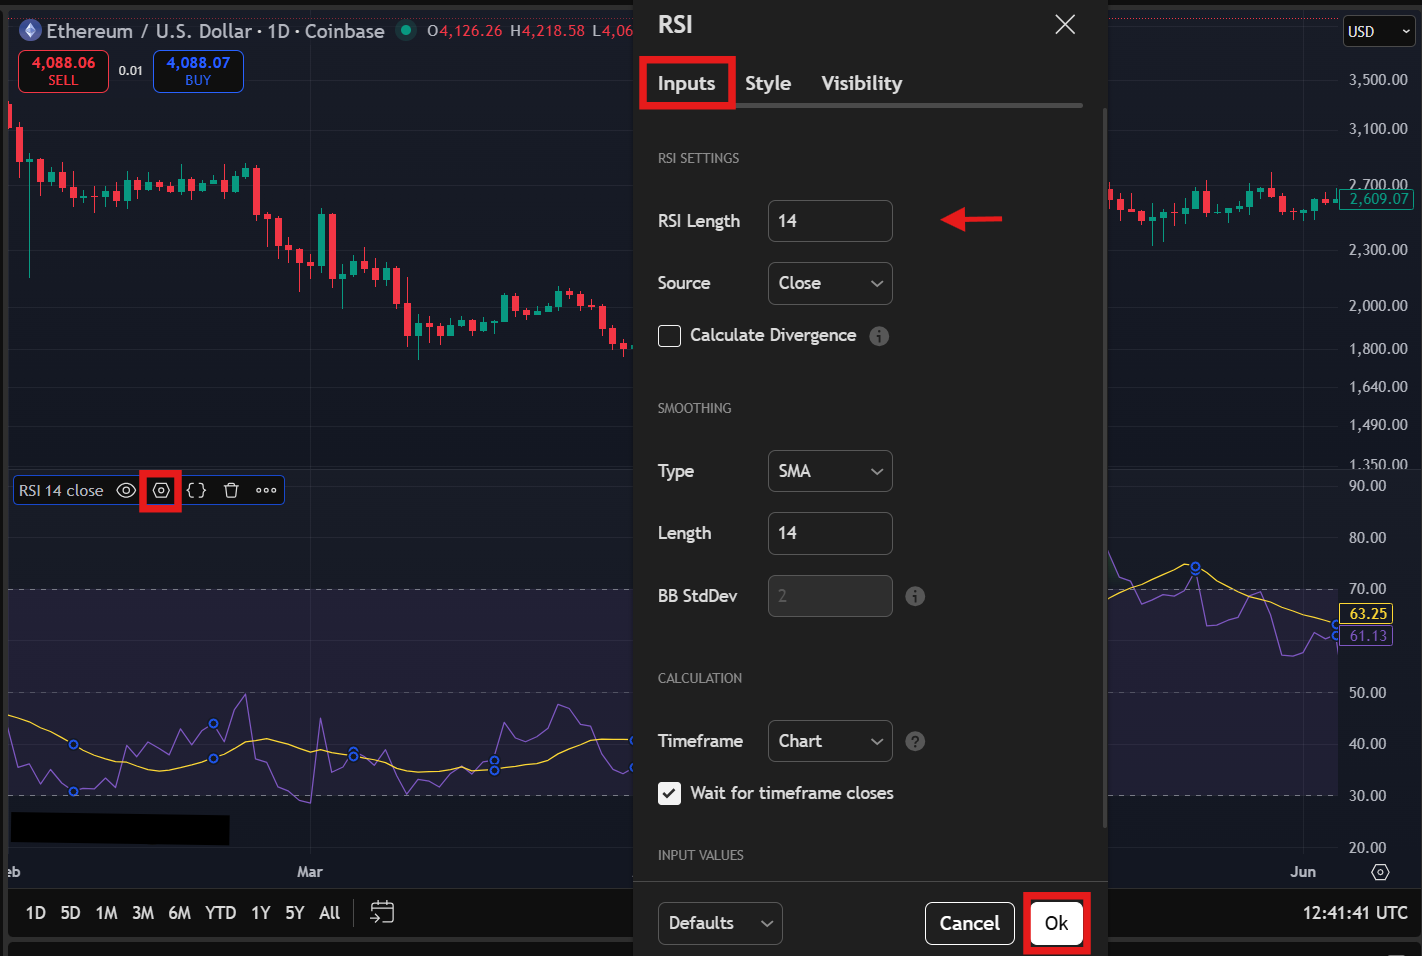
To change the settings of the Relative Strength Index (RSI) indicator, tap the “Settings” icon on the indicator, then click “Inputs” to change the RSI length. Once done, click “Ok” to apply the settings.
How to Use RSI in Crypto Trading?
RSI can help cryptocurrency traders make informed decisions when trading digital currencies.
It can be used in several ways.
1. Identify Entry and Exit Points
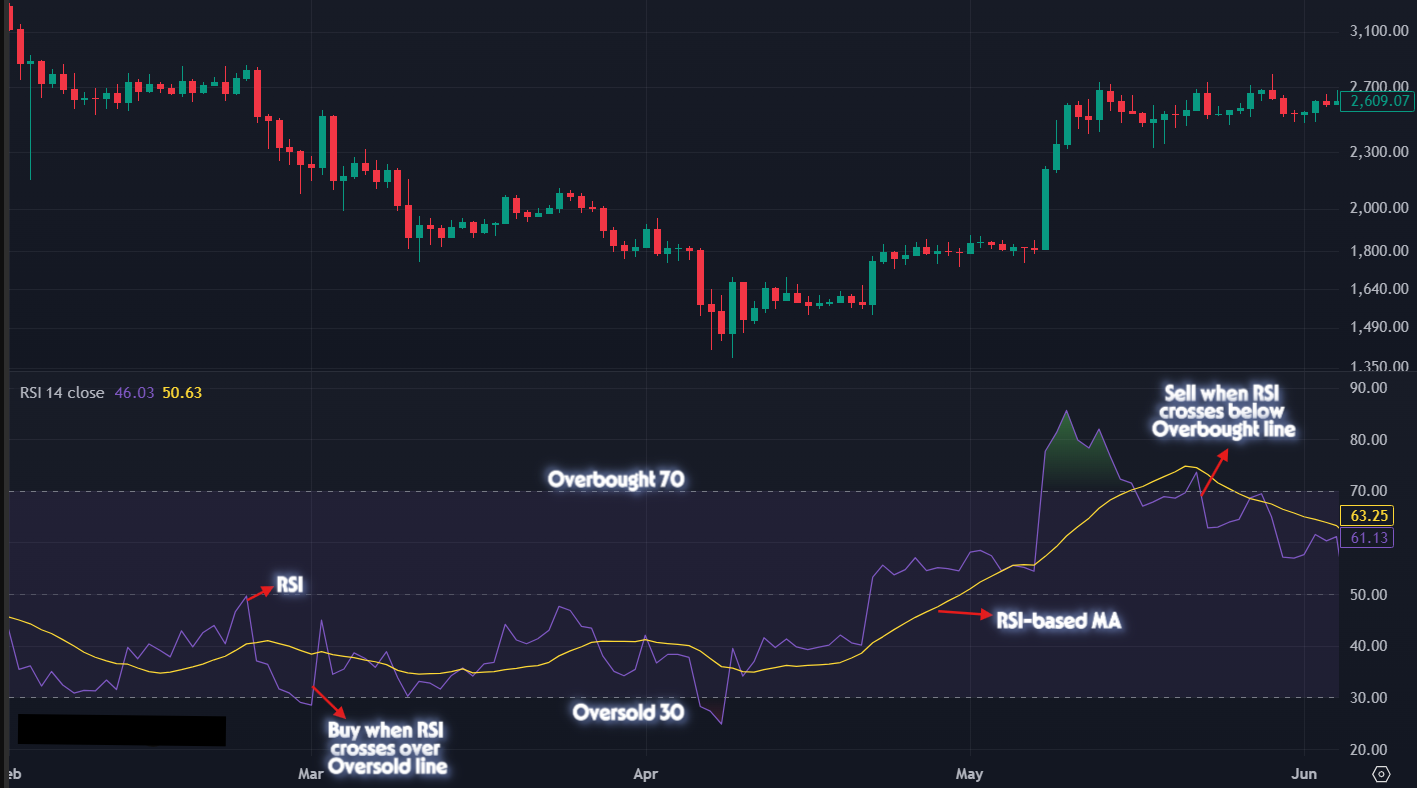
The Relative Strength Index (RSI) indicator helps traders identify when to buy low and sell high a cryptocurrency. For instance, to exit a position, traders might wait for the RSI to cross above the 70-level. Similarly, they could wait for the RSI to cross above the 30-level to open a position.
2. Support and Resistance Levels
RSI can help traders identify key support and resistance levels before they are visible on a crypto chart. A support level is a point where the price tends to stop falling because of increasing buying pressure. A resistance level is a point at which the asset struggles to break above due to rising selling pressure. By identifying these key levels earlier with the help of RSI, traders can predict potential price reversals or breakouts to enter or exit a trade precisely.
3. Swing Trading
The RSI indicator is useful for swing trading, where traders trade between short-term price rises and declines. RSI can provide traders with buying and selling signals. For instance, you might sell when the RSI crosses above 70, buy when it crosses below 30, and then sell again when it crosses above 70.
Limitations of the Relative Strength Index (RSI) Indicator
The RSI is a momentum oscillator that compares bearish and bullish price movements of a digital asset. Like most technical indicators, it has its limitations. RSI can stay above the 70-level for weeks in a bullish momentum and may give false signals. This can mislead traders into selling early. Similarly, it can remain oversold for an extended period when a cryptocurrency has significant momentum in that direction.
Important Reads: Best Indicators for Crypto Trading Every Beginner Should Know
Another challenge traders can face with RSI is when they trade low-liquidity altcoins. The Relative Strength Index (RSI) is less reliable for small-cap coins that are prone to pump and dump. A manipulated volume can distort signals, thus leading traders into a trap. Additionally, RSI has a lagging nature because it relies on past price data, which can cause it to miss sudden price changes, such as flash crashes.
Therefore, it is always recommended to pair RSI with other indicators like moving averages or volume indicators. Analyze the market in a broader context, and adjust the RSI settings to suit your crypto trading strategy.
Final Thoughts
The Relative Strength Index (RSI) is a versatile trading indicator that provides valuable insights into market momentum and price strength. It can help traders identify overbought and oversold market conditions as well as potential trend reversals to get clear buy and sell signals. However, it is a lagging indicator and has limitations. Therefore, when combined with other indicators, such as volume indicators or moving averages, the RSI can perform better and enhance market analysis.
Double your advantage on Bybit: 10% off trades + $30,000 up for grabs! Sign up now and claim these exclusive rewards. Offer expires soon!
Disclaimer: All content on The Moon Show is for informational and educational purposes only. The opinions expressed do not constitute financial advice or recommendations to buy, sell, or trade cryptocurrencies. Trading involves significant risk and may result in substantial losses. Always seek independent financial advice before making investment decisions. The Moon Show is not responsible for any financial losses or decisions made based on the information provided.
Please view the full disclaimer at: https://themoonshow.com/disclaimer

All-time Highs: A Detailed Guide for Crypto Traders
All-time high is the highest price an asset hits since it starts trading. To learn more about A...

What is Degen in Crypto? A Detailed Guide for Traders
Degen in crypto means making high-risk, impulsive bets with not much research. If you are curio...

Understanding Tokenization and How It Is Transforming the Financial Landscape
Tokenization is changing how we perceive real-world assets and digital tokens. Read our blog to...