
What is MACD in Crypto Trading?
As a beginner, trading cryptocurrencies can feel overwhelming. Since cryptocurrencies are volatile digital assets, traders utilize various indicators to gain insight into market movements. One trading indicator that can help you make sense of market movements and make effective decisions is the Moving Average Convergence Divergence (MACD) indicator.
The MACD is a simple yet powerful crypto trading indicator that helps you understand the market direction. It helps analyze price changes to forecast whether a trend is gaining strength or starting to decline. With this indicator, you can spot the right areas to buy or sell digital currencies. However, the MACD indicator has its own limitations, such as not performing well when the market is ranging or moving sideways.
Let’s explore the role of MACD in crypto trading, its components, and how you can use it effectively.
Your $30,000 bonus + 10% discount are waiting on Bybit! Sign up and claim these rewards before they're gone. Time's ticking!
What is MACD in Crypto Trading?
The Moving Average Convergence Divergence (MACD) indicator is a trend following momentum oscillator developed by Gerald Appel in the 1970s. The primary function of the indicator is to assess market momentum and price behaviors to identify potential entry or exit points. In cryptocurrency trading, it reveals the current momentum of a digital asset, including its strength and direction.
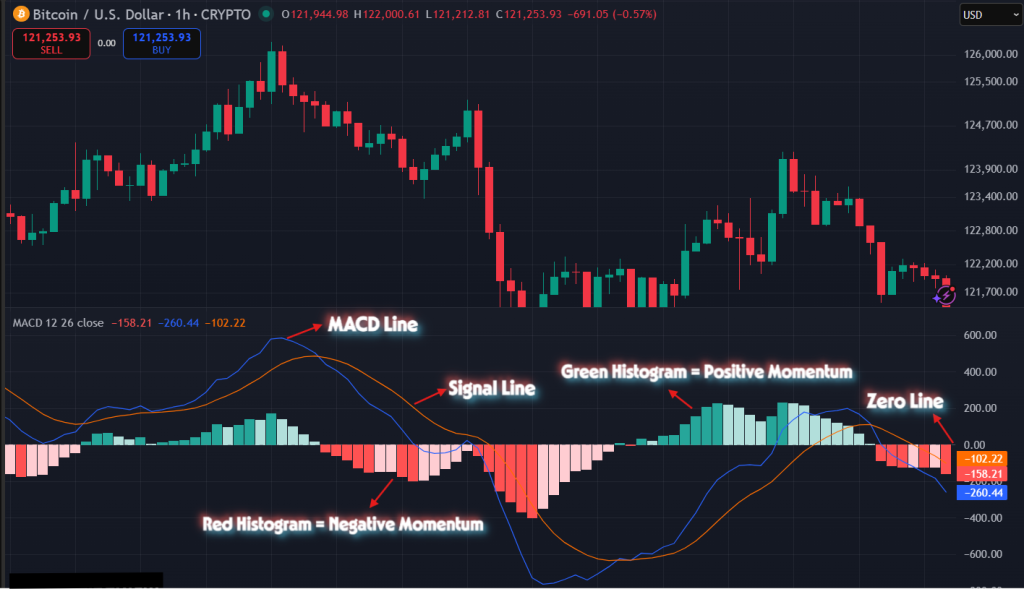
The two main lines of the indicator are the MACD line and the signal line that oscillate between their boundaries. It indicates bullish momentum (a buy signal) when the MACD line crosses above the signal line. Conversely, it shows bearish momentum (a sell signal) when the MACD line crosses below the signal line. Another important line is the zero line, which indicates the point where the short-term EMA equals the long-term EMA, indicating the market momentum is neutral.
Along with these lines, a histogram is also included in the indicator. It illustrates the difference between the signal line and the MACD line, allowing for the identification of a trend's strength and direction. When the trend is bullish (positive momentum), the histogram is colored green and is positioned above the zero line. Conversely, when the trend is bearish (negative momentum), the histogram is colored red and is positioned below the zero line.
The following chart illustrates how the MACD indicator appears when applied to cryptocurrency trading. The selected trading pair is BTC/USDT, and the time frame is 1 hour.
How does the MACD Work?
The MACD indicator analyzes the relationship between two exponential moving averages (EMAs): the 12-period EMA, which reacts quickly to price changes, and the 26-period EMA, which reacts more slowly. The MACD line is created by subtracting the 12-period EMA from the 26-period EMA, indicating the price momentum. For better and clearer signals, the MACD line is compared to a signal line, which is a 9-period EMA of the MACD line itself.
MACD = 12-period EMA - 26-period EMA
The MACD indicator produces a buy signal when the MACD line crosses above the signal line, indicating an upward price momentum. On the other hand, it gives a sell signal when the MACD line crosses below the signal line, indicating a downward price movement. The histogram shows the difference between the signal line and the MACD line. It visualizes the strength of trends, with larger bars indicating stronger momentum, shrinking bars suggesting weakening momentum, and falling bars showing a negative momentum.
Best MACD Indicator Settings for Crypto Trading
When using the MACD indicator for the first time, selecting the correct settings can make a significant difference. It helps you identify trends and signals more accurately.
Let’s find out several ways you can change the settings of the MACD indicator.
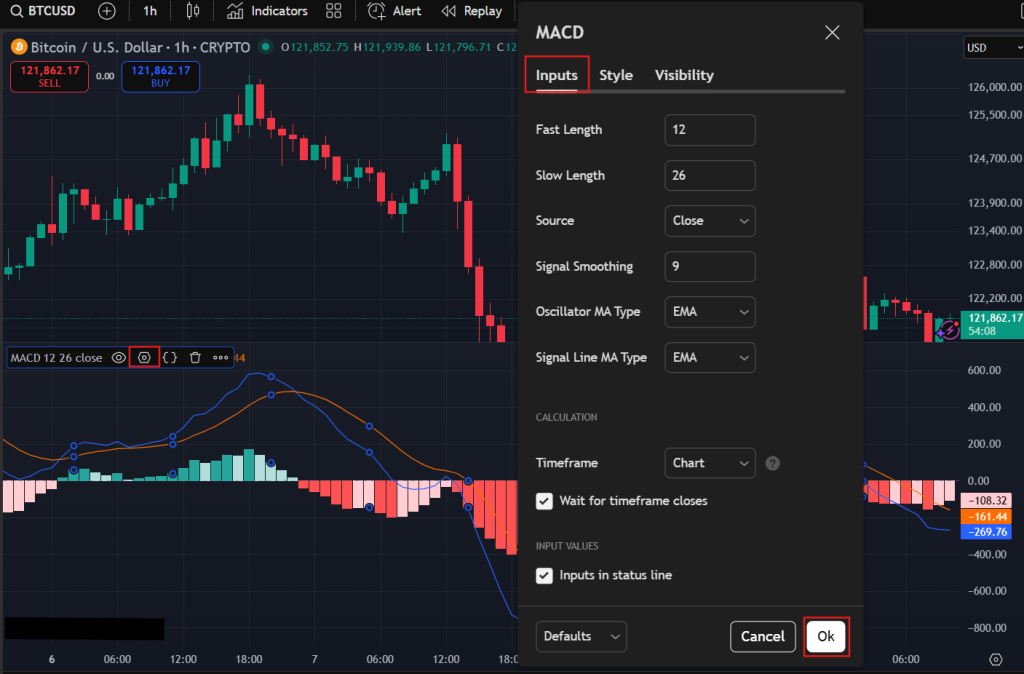
- Default Settings (12, 26, 9): The 12-period EMA, 26-period EMA, and 9-period signal line are suitable for general crypto trading. It strikes a balance between responsiveness and smoothness, enabling you to identify both short-term and long-term trends.
- Faster Settings (6, 13, 5): The 6-period EMA, 13-period EMA, and 5-period signal line are designed for active traders who focus on shorter time frames, such as 5 minutes or 15 minutes, to capture quicker price movements.
- Slower Settings (24, 52, 18): If you are following longer trends or trade on daily or weekly charts, the 24-period EMA, 52-period EMA, and 18-period signal line can help reduce false signals and capture more reliable long-term trends.
Remember, you can adjust the indicator's settings to suit your preferred trading strategy. Once applied to the chart, tap the “Settings”icon on the indicator, then click “Inputs” to change these numbers. Once done, click “Ok” to apply the settings.
How to Use the MACD Indicator in Crypto Trading?
When trading cryptocurrencies, you can use the Moving Average Convergence Divergence (MACD) indicator in several ways. It helps you identify trends and confirm market conditions.
1. Signal Line Crossover
Traders commonly use the MACD indicator to spot potential buying and selling opportunities. When the MACD line crosses above the signal line, a buy signal is triggered, indicating an increase in momentum and a favorable opportunity to purchase digital assets. Conversely, a sell signal occurs when the MACD line crosses below the signal line, indicating a decline in momentum and a suitable time to sell digital currencies.
2. Zero Line Crossover
When the MACD line crosses above the Zero line, it can be taken as a bullish signal, indicating that momentum is increasing. On the other hand, when the MACD line moves below the zero line, it gives a bearish signal.
3. Divergences
When the price of a cryptocurrency and the MACD line move in opposite directions, it is referred to as a divergence. It suggests that a trend is about to reverse, and the price will rise or fall. You can identify it on a chart by examining the price trend in comparison to the MACD line.
A bullish divergence occurs when the price falls and the MACD rises, indicating that the downward trend is weakening and a potential upward reversal may be underway. In contrast, a bearish divergence occurs when the MACD falls and the price rises, indicating that the upward trend is losing momentum and a possible downward reversal can follow.
4. Finding Momentum
You can use the histogram of the MACD indicator to identify market momentum. The histogram represents the difference between the signal line and the MACD line. Its size shows the strength of a trend. Increasing bars indicate strong momentum in the current direction, while decreasing bars suggest weakening momentum, which could hint towards a trend reversal. However, a slowing trend does not guarantee a reversal and mainly indicates slow momentum.
Important Reads: What is the On-Balance Volume (OBV) Indicator?
Limitations of MACD
The MACD is a trend-following momentum oscillator that oscillates above and below a zero line, indicating the strength and direction of a trend. It is undoubtedly a helpful technical indicator to make informed decisions when trading cryptocurrencies. However, like other technical indicators, the MACD has its limitations and cannot predict future price movements in certain market conditions.
A primary drawback of the MACD indicator is its lagging nature. The indicator sometimes produces late or even false signals when the market is in a sideways trend. The MACD is preferred by traders in trending markets when it performs optimally.
Another limitation of the MACD indicator is that it does not measure the overbought or oversold market levels. When its values are extreme or the histogram is overextended, it hints at a potential exhaustion in a trend. Therefore, to avoid such challenges, traders often combine it with other indicators, such as the Relative Strength Index (RSI), to better assess market conditions.
Final Thoughts
The Moving Average Convergence Divergence (MACD) is a powerful technical indicator that helps identify potential entry and exit points. It provides valuable insights into price momentum and trend reversals. However, like other technical indicators, relying solely on the MACD indicator can lead to suboptimal trades. Therefore, combining MACD with other indicators, such as the RSI and Stochastic RSI, can help you confirm and validate trading signals more authentically.
Double your advantage on Bybit: 10% off trades + $30,000 up for grabs! Sign up now and claim these exclusive rewards. Offer expires soon!
Disclaimer: All content on The Moon Show is for informational and educational purposes only. The opinions expressed do not constitute financial advice or recommendations to buy, sell, or trade cryptocurrencies. Trading involves significant risk and may result in substantial losses. Always seek independent financial advice before making investment decisions. The Moon Show is not responsible for any financial losses or decisions made based on the information provided.
Please view the full disclaimer at: https://themoonshow.com/disclaimer

All-time Highs: A Detailed Guide for Crypto Traders
All-time high is the highest price an asset hits since it starts trading. To learn more about A...

What is Degen in Crypto? A Detailed Guide for Traders
Degen in crypto means making high-risk, impulsive bets with not much research. If you are curio...

Understanding Tokenization and How It Is Transforming the Financial Landscape
Tokenization is changing how we perceive real-world assets and digital tokens. Read our blog to...