
Ethereum (ETH) Price Analysis: Key Levels to Watch as Market Signals Downside Risk
Ethereum is currently hovering around $4,300 and moving slowly on the lower timeframes. As highlighted in our previous analysis, ETH is being squeezed toward $4,250, consistently forming lower highs. While bulls have held the $4,250 support well, they haven’t managed to drive any significant upside momentum. With price struggling to break higher and volume lacking, further downside looks likely for ETH in the short term. Let’s take a look at the latest Ethereum charts to see where the price may head in the coming days.
Sign up and deposit on WEEX to secure a 20% bonus. Complete phone and email binding to claim a coupon of up to 100 USDT, with more trading rewards available.
Analyzing the Ethereum Charts
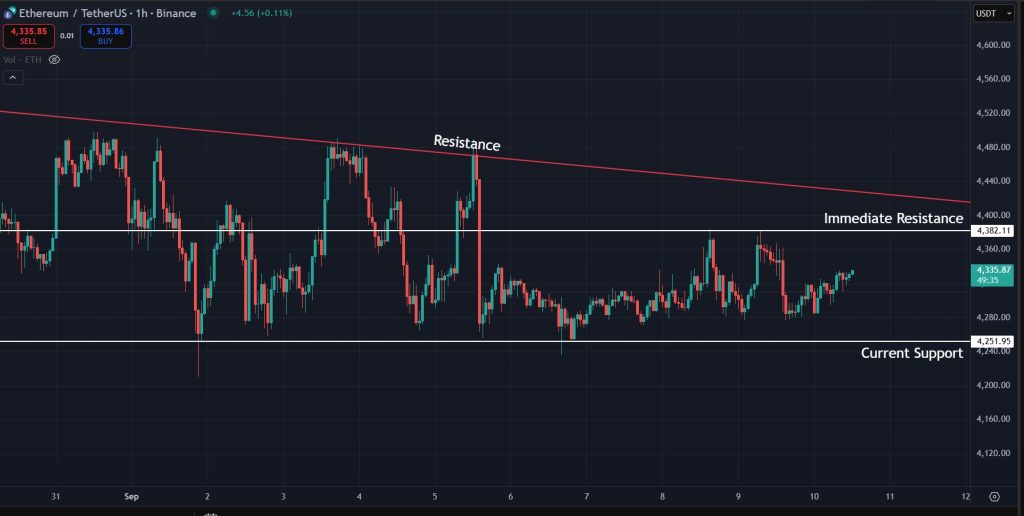
If we take a look at the latest 1-hour charts for ETH, we can see that the price is holding the $4,250 mark but struggling to gain any momentum from this level. There is clear trendline resistance forcing the price to form lower highs, along with horizontal resistance just below $4,400. This area has acted as both support and resistance in the recent past.
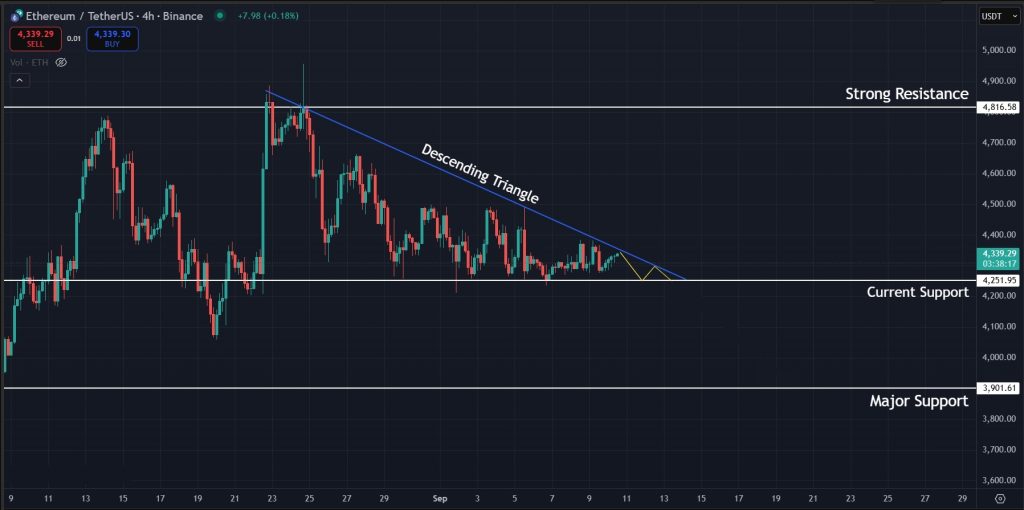
Switching to the 4-hour charts, we can see a descending triangle forming, which is statistically a bearish pattern. The price continues to be squeezed toward the $4,250 mark, and with each bounce from this level, sellers gain more control. If this structure plays out in the short term, our Ethereum price prediction leans bearish, with a breakdown target near $3,900, a major support region.
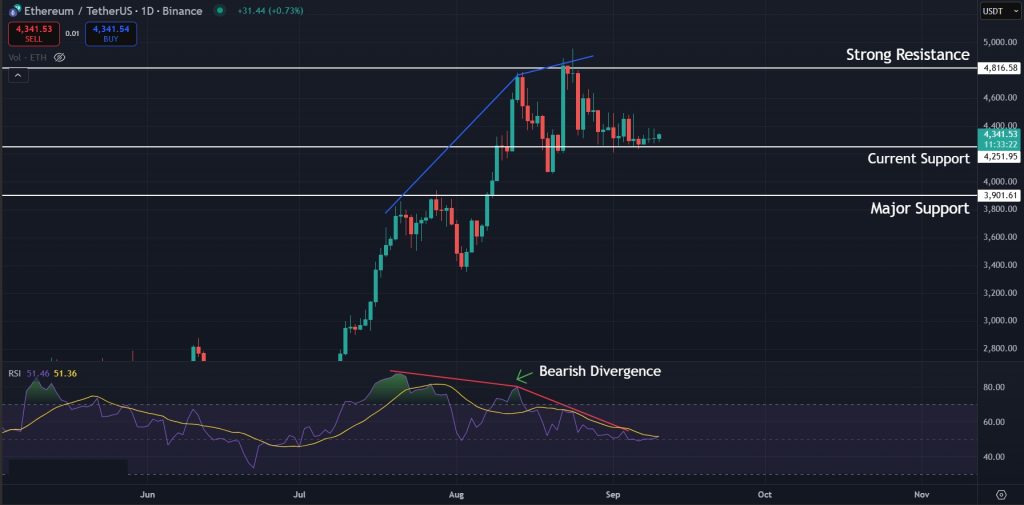
We are also seeing a strong bearish divergence on the 1-day timeframe, indicating that ETH is heading toward a correction. No indicators have invalidated this bearish divergence yet, so the price is still expected to move toward a correction in the coming weeks.
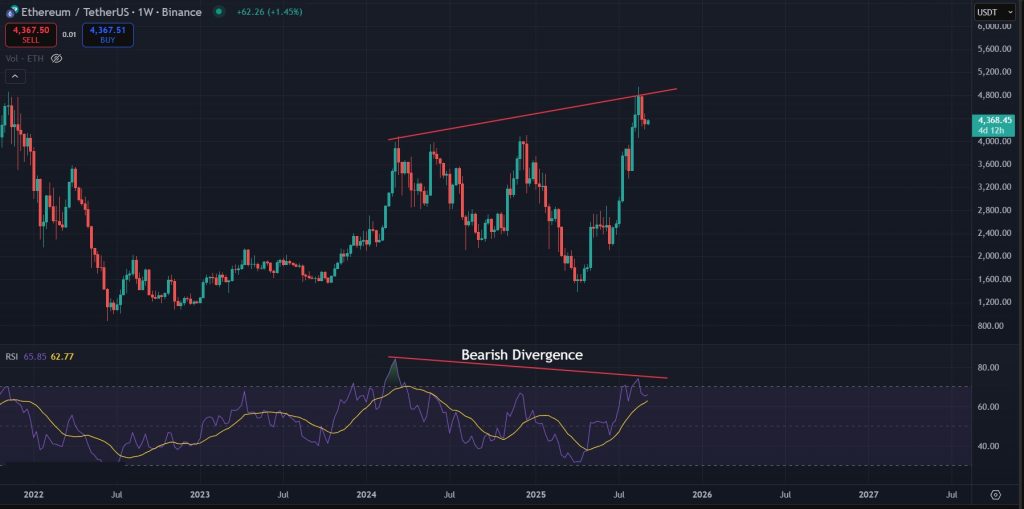
Furthermore, there is another bearish divergence on the 1-week timeframe, adding more evidence that Ethereum is currently in the overbought range. This bearish divergence has been active for a while and has not yet been invalidated by price action.
Final Takeaway: What is Next for Ethereum (ETH)?
Ethereum is currently trading around the $4,300 mark and continues to be squeezed on the lower timeframes. Although a short-term breakout is possible here due to the ongoing squeeze, the broader structure still points more toward a correction and a likely retest of the region below $4,000. In addition, Ethereum is also showing a couple of bearish divergences across multiple timeframes, which further strengthens the case for a potential correction in the coming weeks.
Start trading on WEEX and receive a 20% deposit bonus. Bind your phone and email to unlock a 10–100 USDT coupon and access extra trading rewards.

Bitcoin (BTC) Price Analysis: Hidden Bullish Divergenc . . .
I disclaim responsibility for any losses, injuries or damages resulting from the display or use of any information.

Scroll DAO Pauses Governance Amid Leadership Shake-Up . . .
I disclaim responsibility for any losses, injuries or damages resulting from the display or use of any information.

BitMine Expands ETH Holdings to $9.2B After Second Maj . . .
I disclaim responsibility for any losses, injuries or damages resulting from the display or use of any information.
Top Deals


